![Manufacturing jobs just ain’t what they used to be]()
by Scott McLeod | May 31, 2009 | Leadership and Vision, Our Changing World, Research and Evaluation |
In my never-ending quest to wrap my head around workforce data despite no background or training whatsoever, I’ve been playing around with the Bureau of Labor Statistics (BLS) web site. But first a quick look at General Motors (GM)! [click on all images for larger versions]
General Motors has a shrinkage issue
As many of you know, GM has been in the news lately as it faces possible bankruptcy proceedings. The image below shows the shrinkage of GM’s workforce over a generation.

Combine this image with all of the other news on the U.S. automobile industry and it’s easy to see that automotive jobs in America, at least as they’ve traditionally been configured, often are a loser’s game due to lower costs and, often, higher quality overseas.
Hey, how are we supposed to make a living?
Below are two charts that I made after diving deep into the BLS Industries At A Glance data, particularly the historical trend data. The first chart shows that the number of employees in the professional and business services, financial activities, and education and health services supersectors grew substantially over the past three decades. In contrast, the manufacturing supersector has lost over a third of its employees and those job losses show no signs of slowing down any time soon. Of course the education and skills needed for these growth sectors of the American economy are different and/or higher than those needed for most manufacturing jobs. FYI, the data points are from the month of April for each year.

The second chart shows the average increase in real earnings since 1980, broken out by labor supersector and adjusted for inflation. As you can see, not only are manufacturing jobs disappearing, those that are left actually have seen a decline in inflation-adjusted earnings over the past three decades. In other words, the purchasing power of your average manufacturing employee is less than it was three decades ago. Not so for the other three supersectors in the chart. I’m no workforce expert but this doesn’t seem to make a strong argument for the manufacturing industry here in America until our companies figure out how to effectively navigate overseas competition despite higher wages, corporate health care and other legacy costs, Americans’ expectations regarding standard of living, and other issues.

I’m not completely sure what to make of all of this. Right now I’m trying to locate data and present them in ways that make sense to me because I have a sense that this stuff is pretty important. As I share this out, your thoughts and expertise are welcome!
One last thing
FYI, despite my best efforts with it, Wolfram Alpha was of no help whatsoever with this investigation. Maybe down the road as it gets more sophisticated, increases its store of data, etc.
Related posts
by Scott McLeod | May 10, 2009 | Higher Education, Learning and Teaching, Our Changing World, Pre-Service Preparation, Research and Evaluation, Tech Integration, Tech Tools, Videos |
Here are two presentations by Dr. Richard Miller, Chair of the English Department at Rutgers University, that are well worth any university instructor's time to watch.
The Future Is Now: Presentation to the RU Board of Governors
This Is How We Dream, Part 1 and Part 2
![Manufacturing jobs just ain’t what they used to be]()
by Scott McLeod | Apr 15, 2009 | 21st Century Skills, Higher Education, Our Changing World, Research and Evaluation |
A pilot study at Ohio State University has found that Facebook users in college have lower grades and spend less time studying. I pieced together the following chart from the news release:

Aryn Karpinski, a co-author of the study and doctoral student in education at Ohio State University, said that:
There may be other factors involved, such as personality traits, that link Facebook use and lower grades. It may be that if it wasn’t for Facebook, some students would still find other ways to avoid studying, and would still get lower grades. But perhaps the lower GPAs could actually be because students are spending too much time socializing online.
The news release noted that:
Typically, Facebook users in the study had GPAs between 3.0 and 3.5, while non-users had GPAs between 3.5 and 4.0. In addition, users said they averaged one to five hours a week studying, while non-users studied 11 to 15 hours per week.
Karpinski said it was significant that the link between lower grades and Facebook use was found even in graduate students. She said that graduate students generally have GPAs above 3.5, so the fact that even they had lower grades when they used Facebook — and spent less time studying – was an amazing finding.
My reaction when I started reading the news release was “They found some undergrads who aren’t using Facebook?” Then, sure enough, I found when I calculated the numbers that there were a mere 15 undergraduate non-Facebook users in the study.
I confess that I’m a little wary of some of Karpinski’s generalizations. Although she noted that other factors may be involved besides Facebook use or non-use, the ones that she hypothesized have to do with personality traits and/or predilection for online socialization.
Right now I’m not totally convinced that these findings don’t just represent the fact that about 80% of her non-Facebook users were graduate students. I think it’s safe to say that grad students generally spend more time studying than undergrads. Also, as she noted, grad students’ GPAs typically are higher.
In my mind, the overall generalizations from the study don’t seem to adequately recognize the extremely heavy skew in the non-Facebook group toward graduate students. If I saw that the data (to which she alluded) show that the lower grade trend for grad students was of equivalent size to the undergrad group, then I’d have more confidence in the overall generalizations that are being made in the news release.
Maybe Karpinski will find this post and share some more about her study. Clearly it’s a provocative topic and, if replicated at a larger scale, might provide some really useful information. While her data likely won’t curb Facebook use among college students, they might at least help us understand the potential impact of social networking on postsecondary academic achievement.
One final note: We all should look at – and think carefully about – any research findings that get reported out like this. We need to ask questions like Does this make gut-level sense? and Are the generalizations limited to the data or overbroad? and What more do I need to know to be confident in these findings?. Being informed consumers of research is critical if we are to make research- and/or data-driven decisions to benefit our students.
![Manufacturing jobs just ain’t what they used to be]()
by Scott McLeod | Apr 5, 2009 | Leadership and Vision, Our Changing World, Research and Evaluation |
[cross-posted at LeaderTalk]
As we all know, we are in the midst of a massive economic downturn. Every month is accompanied by reports of additional, large-scale layoffs. People are losing their jobs in significant numbers. And yet, despite claims that job losses are being felt throughout all areas of the economy, U.S. Bureau of Labor Statistics data clearly show that the impacts of this recession are being felt more heavily by some rather than others.
For example, employees with a 4-year college degree or higher are losing their jobs at a much lower rate than other workers [click on image for larger version]:

Similarly, jobs in more ‘professional’ employment sectors are being lost at a much lower rate than those that traditionally have required fewer skills and/or education:

And certain industries are feeling the pain of unemployment much more than others (see more detail if you’re interested):

The numbers here in Iowa parallel what is happening across the nation. For example, although our state is weathering the recession better than many, the latest Iowa Workforce Development report shows that 20,000 of the 22,400 non-agricultural jobs lost over the past year are in manufacturing.
The labor statistics over the past year mirror longer-term trends in the American workforce. As the charts below show, the U.S. is now a country in which 75% of our workforce is employed in what Dr. Richard Florida calls ‘service class’ or ‘creative class’ professions. Lower-skill and lower-wage jobs that fall outside these two categories, such as those in manufacturing, are more likely to be lost both in the short and long term.


Creative-class jobs, which now make up at least a third of the American workforce and are the only segment of the economy that is growing long-term, require different skill sets such as complex communication, critical thinking, and collaborative problem-solving. These are skills for which schools typically have not prepared most of their graduates.


So what do all of these charts tell us? Well, there are no absolute guarantees that your school system’s graduates won’t lose their jobs. But it’s fairly clear that the best way to immunize your graduates from the potential of job loss is to give them the skill sets that they’ll need to 1) acquire an advanced education, and 2) obtain jobs in professional sectors that are long-term growth areas for the American economy (and thus are less vulnerable to short- or long-term downturns). This raises an obvious question, of course: How’s your school system doing at this?
by Scott McLeod | Mar 10, 2009 | 21st Century Skills, Assessment, Law, Policy, and Ethics, Leadership and Vision, Learning and Teaching, News and Events, Our Changing World, Quotes, Research and Evaluation |
The President is calling:
I’m calling on our nation’s governors and state education chiefs to develop standards and assessments that don’t simply measure whether students can fill in a bubble on a test, but whether they possess 21st century skills like problem-solving and critical thinking and entrepreneurship and creativity.
President Barack Obama, March 10, 2009
Alia iacta est. How will we answer the call?
by Scott McLeod | Mar 7, 2009 | 21st Century Skills, Blogging, CASTLE, Law, Policy, and Ethics, Leadership and Vision, Learning and Teaching, News and Events, Our Changing World, Planning and Funding, Pre-Service Preparation, Professional Development, Quotes, Research and Evaluation, Tech Integration, Tech Tools |
I've had a lot of fun guest blogging over at The Des Moines Register this week. For those of you who would like to have a single link that you can forward to others, you can use this web address:
![Manufacturing jobs just ain’t what they used to be]()
by Scott McLeod | Mar 7, 2009 | 21st Century Skills, Law, Policy, and Ethics, Leadership and Vision, Learning and Teaching, Our Changing World, Research and Evaluation, Tech Integration |
[This is Post 5 for my guest blogging stint at The Des Moines Register.]
Archimedes said “Give me a lever long enough and I can move the world.” This week I am blogging about 5 key levers that I think are necessary to move Iowa schools forward and help our graduates survive and thrive in this new digital, global age in which we now live. Earlier I discussed the need for 21st century curricula, a robust system of online learning, providing a computer for every student, and investing in leadership. Today’s post concerns the need for better information.
Although the Iowa Department of Education does not collect school district technology plans as many other states do, it does have other mechanisms for collecting some information about technology in K-12 schools. Much of that is reported out in the annual Iowa Condition of Education report. For example, the most recent report tells us that back in 1997–1998 Iowa school districts used to spend nearly $100 per pupil on computer software and hardware. By 2006–2007, that figure had dropped to an average of only $77. Adjusted for inflation, that figure is only $61 ($1.00 in 1998 had the same buying power as $1.27 in 2007).

In other words, our world is becoming increasingly technological but our expenditures on technology in Iowa schools have decreased substantially. Iowa public schools spent $37.3 million on technology last year. It would take a 27% increase – another $9.9 million – to get us back to the spending rates of a decade ago. Adjusted for the reduced buying power of the 2007 dollar, those figures are 48% and $17.8 million respectively.
The Iowa Condition of Education also contains other useful information, such as the state average number of pupils per computer (supposedly at 3.2) and the percentage of high schools (87%), middle schools (81%), and elementary schools (71%) that reportedly have wireless networks. The Iowa Department of Education has all of this information in its database by school and district. But as useful as these data are, there is a lot of information that the Department doesn’t collect. As a result, there are a number of questions that have no useful answers.
Here are some questions that we should be asking in Iowa:
- What percentage of Iowa schools and districts have a technology plan? For those that do, what do those plans cover?
- What percentage of Iowa schools and districts have technology teams that advise the organization on technology-related concerns? Who’s on those teams?
- What are schools purchasing with their hardware and software money? What proportion of expenditures goes to teacher-centric technologies versus student-centric technologies? What proportion goes to software that provides powerful learning opportunities for students versus software that simply focuses on drill-and-kill remediation?
- How new are the computers in Iowa schools? What percentage of Iowa hardware and software is more than 2 years old?
- How many Iowa school districts have a student information system? a data warehouse system? electronic gradebook software? electronic student assessment systems? financial, human resources, food service, special education, or other management systems?
- On average, how much time per week do students get to use digital technologies as part of their classroom learning? What proportion of that time is spent using office productivity software, doing basic Internet research, engaging in online social media environments, or utilizing other technologies?
- How many districts have a technology coordinator? Is that person also doing other jobs?
- What is the average number of technology support personnel per teacher? per student? per building or district?
- What is the average number of technology integrationists per teacher? per building or district?
- What percentage of Iowa classrooms (not buildings) have wireless access?
- What percentage of Iowa classrooms have LCD screens or projectors large enough to display a computer screen image that the entire class can see easily? speakers so that the entire class can hear audio or video easily?
- What percentage of Iowa teachers have a webcam?
- What percentage of Iowa students have ever taken an online class? For those that have, what are they taking? How many wish that they had better access to online learning opportunities? What about the same set of questions for teachers?
- What percentage of Iowa students are involved in 1:1 laptop programs?
- What percentage of Iowa schools have the Internet bandwidth and other supports to effectively implement a 1:1 laptop program?
- How do Iowa students think and feel about technology integration in their classrooms? How about teachers, administrators, parents, or school board members?
- On average, how much time per year do Iowa teachers spend in technology-related professional development activities? How do they spend that time?
- What are the technology-related training needs of Iowa teachers and administrators? the technology support needs?
- What does Internet filtering look like in Iowa schools?
- What percentage of Iowa students’ families have Internet access at home? For those that do, is it dial-up or broadband?
- What percentage of Iowa students have computers at home? cell phones? digital cameras? portable music players? video game consoles? other devices? What percentage of teachers or administrators?
- How often do students use the Internet at home and for what do they use it? How about teachers or administrators?
- and so on…
These are all questions for which I’m pretty sure we don’t have much data. Yet the answers to every one of these would be highly informative to how we think about K-12 technology policy, funding, and implementation. So we have a disconnect. And because of that disconnect, we are making purchasing, staffing, funding, and other decisions without the necessary data to inform ourselves.

Who would collect this information? Well, the Iowa Department of Education could take on more of this. Or perhaps the Iowa State Education Association, the School Administrators of Iowa, and/or the Iowa Association of School Boards. Or even a university research center like CASTLE. But the will and the funding for this has to come from somewhere.
So, like everything else, there is a cost involved. But the bigger cost is that we’re navigating blindly because we don’t have the critical information that we need to adequately and appropriately make instructional, operational, and policy decisions. Some money and effort expended now on gathering better information could save a lot of money and effort later on…
by Scott McLeod | Jan 25, 2009 | Research and Evaluation, Safety and Security |
Harvard University's Berkman Center for Internet and Society just released a massive report, Enhancing Child Safety and Online Technologies. Here's a quote from the study:
Sexual solicitation and predation are serious concerns, but the image presented by the media of an older male deceiving and preying on a young child does not paint an accurate picture of the nature of the majority of sexual solicitations and Internet-initiated offline encounters; this inaccuracy leads to major risks in this area being ignored. Of particular concern are the sexual solicitations between minors and the frequency with which online-initiated sexual contact resembles statutory rape rather than other models of abuse. Finally, though some technologies can be more easily leveraged than others for solicitation, risk appears to be more correlated with a youth’s psychosocial profile and risky behaviors than any particular technological platform.
by Scott McLeod | Nov 28, 2008 | Blogging, Edublogger research, Research and Evaluation |
I read with great interest the other day Jeff Utecht’s post regarding his declining Technorati authority. Although I agree with others that Technorati has some deficiencies as a blogging metric, it still can be a useful tool to help monitor conversations and online presence.
Like Jeff and the handful of other blogs that he mentions, I also have seen Dangerously Irrelevant’s authority decline, particularly in the past few months. I have been attributing this to:
- my less frequent posting this semester;
- a return in late September to the blog’s appropriate level after a temporary ‘authority boost’ from an unusually popular post last March; and
- the natural competition for comments and links that results from an ever-increasing number of high-quality edublogs.
Jeff hypothesizes that another factor may be Twitter. As many of us move our conversations that direction, fewer posts and/or comments are occurring in the edublogosphere. I’m an infrequent tweeter, so while Twitter may explain The Thinking Stick’s decline, it doesn’t really explain my own. In Jeff’s comments section, Sue Waters also notes that the decreases in authority may be due to the recent changes in Technorati’s indexing methodology.
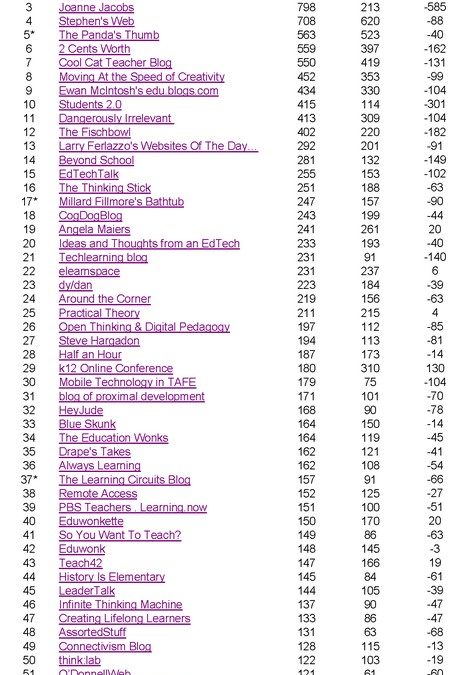
It’s hard to say exactly what’s going on here. Probably all of the reasons above and more. I wasn’t losing sleep about my own Technorati decrease, but Jeff’s post intrigued me because I hadn’t thought about the fact that others might also be having a similar decline. I found the time this morning to extend Jeff’s quick calculations to the entire list of edublogs from my post in June. Here’s what I found…
[note: I simply worked with the list from June. I did not recalculate the ‘top 50’ nor did I determine if any new blogs should be included instead of those listed.]
1. Nearly all of the top edublogs (as measured by Technorati authority) saw a decline in their authority since June.
As the chart below shows, some edublogs had quite dramatic decreases. The average authority decrease was 88; the median decrease was 62. [click on the image for a larger version]

2. Using today’s numbers, the list would look like this instead.

3. Here’s the list ordered by gain/loss in authority rather than overall authority. Only six blogs saw an increase in authority since June.

4. Here’s the list ordered by change in overall rank (again, within just this list and not the overall edublogosphere).

5. Finally, here’s a graphic that shows each blog’s change in rank since June (ordered by overall authority). Red is a decline; green is an increase; blue is no change.

Last thoughts
- Like Jeff (and unlike many of you!), I find much of this fascinating. For example, think:lab’s rank went up 11 spots despite the fact that Christian Long quit blogging there in August. That was a neat trick, Christian (and, BTW, I hope your new gig’s working out well for you)!
- The top part of the list was pretty stable. Most of the movement occurred outside of the top 10 or so positions.
- Students 2.0 had the biggest drop in the rankings. Was it so high before because we liked the content better compared to now? Or were we simply giddy with the idea behind the blog but now have realized that the content is not as relevant to many of us?
- Is the TechLearning blog’s decline due in part to its general inability to accept comments?
- The K12 Online Conference blog rankings likely are cyclical. Up in the fall just before and after the conference. Down six months later as all of the traffic regarding the conference drops off Technorati’s radar. Time will prove if I’m right or not on this one!
- Kudos to the bloggers (Angela Maiers, Jennifer Jennings, Steve Dembo, George Siemens, and Chris Lehmann) who actually increased their Technorati authority in the face of steep overall declines. Wow.
Any of you have thoughts on this fairly esoteric stuff?
![Manufacturing jobs just ain’t what they used to be]()
by Scott McLeod | Oct 22, 2008 | 21st Century Skills, Assessment, Leadership and Vision, Learning and Teaching, Online Learning, Planning and Funding, Professional Development, Reading, Research and Evaluation, Tech Integration |
 The State Educational Technology Directors Association (SETDA) has been on an unbelievable tear this year. Back in February it released its annual Trends Report on NCLB Title II, Part D (Enhancing Education Through Technology, or E2T2). Previous national reports are available at the SETDA web site. You also can access state-level reports at the Metiri Group’s web site.
Now SETDA’s Class of 2020 Action Plan for Education project is releasing its reports. The first three already are available:
Two more reports are coming out this month and next:
Be sure to tap into the incredible wealth of good information on the Reports, Research & Tools page of the SETDA web site [warning: it’s easy to get lost in here for hours…]. There are numerous high-quality resources available for K-12 educational technology advocates and change agents, including the 2007 report, Maximizing the impact: The pivotal role of technology in a 21st century education system.
Keep up the great work, SETDA!


